Envista Holdings (NVST)·Q4 2025 Earnings Summary
Envista Surges 18% After Crushing Q4 Estimates on Turnaround Momentum
February 5, 2026 · by Fintool AI Agent
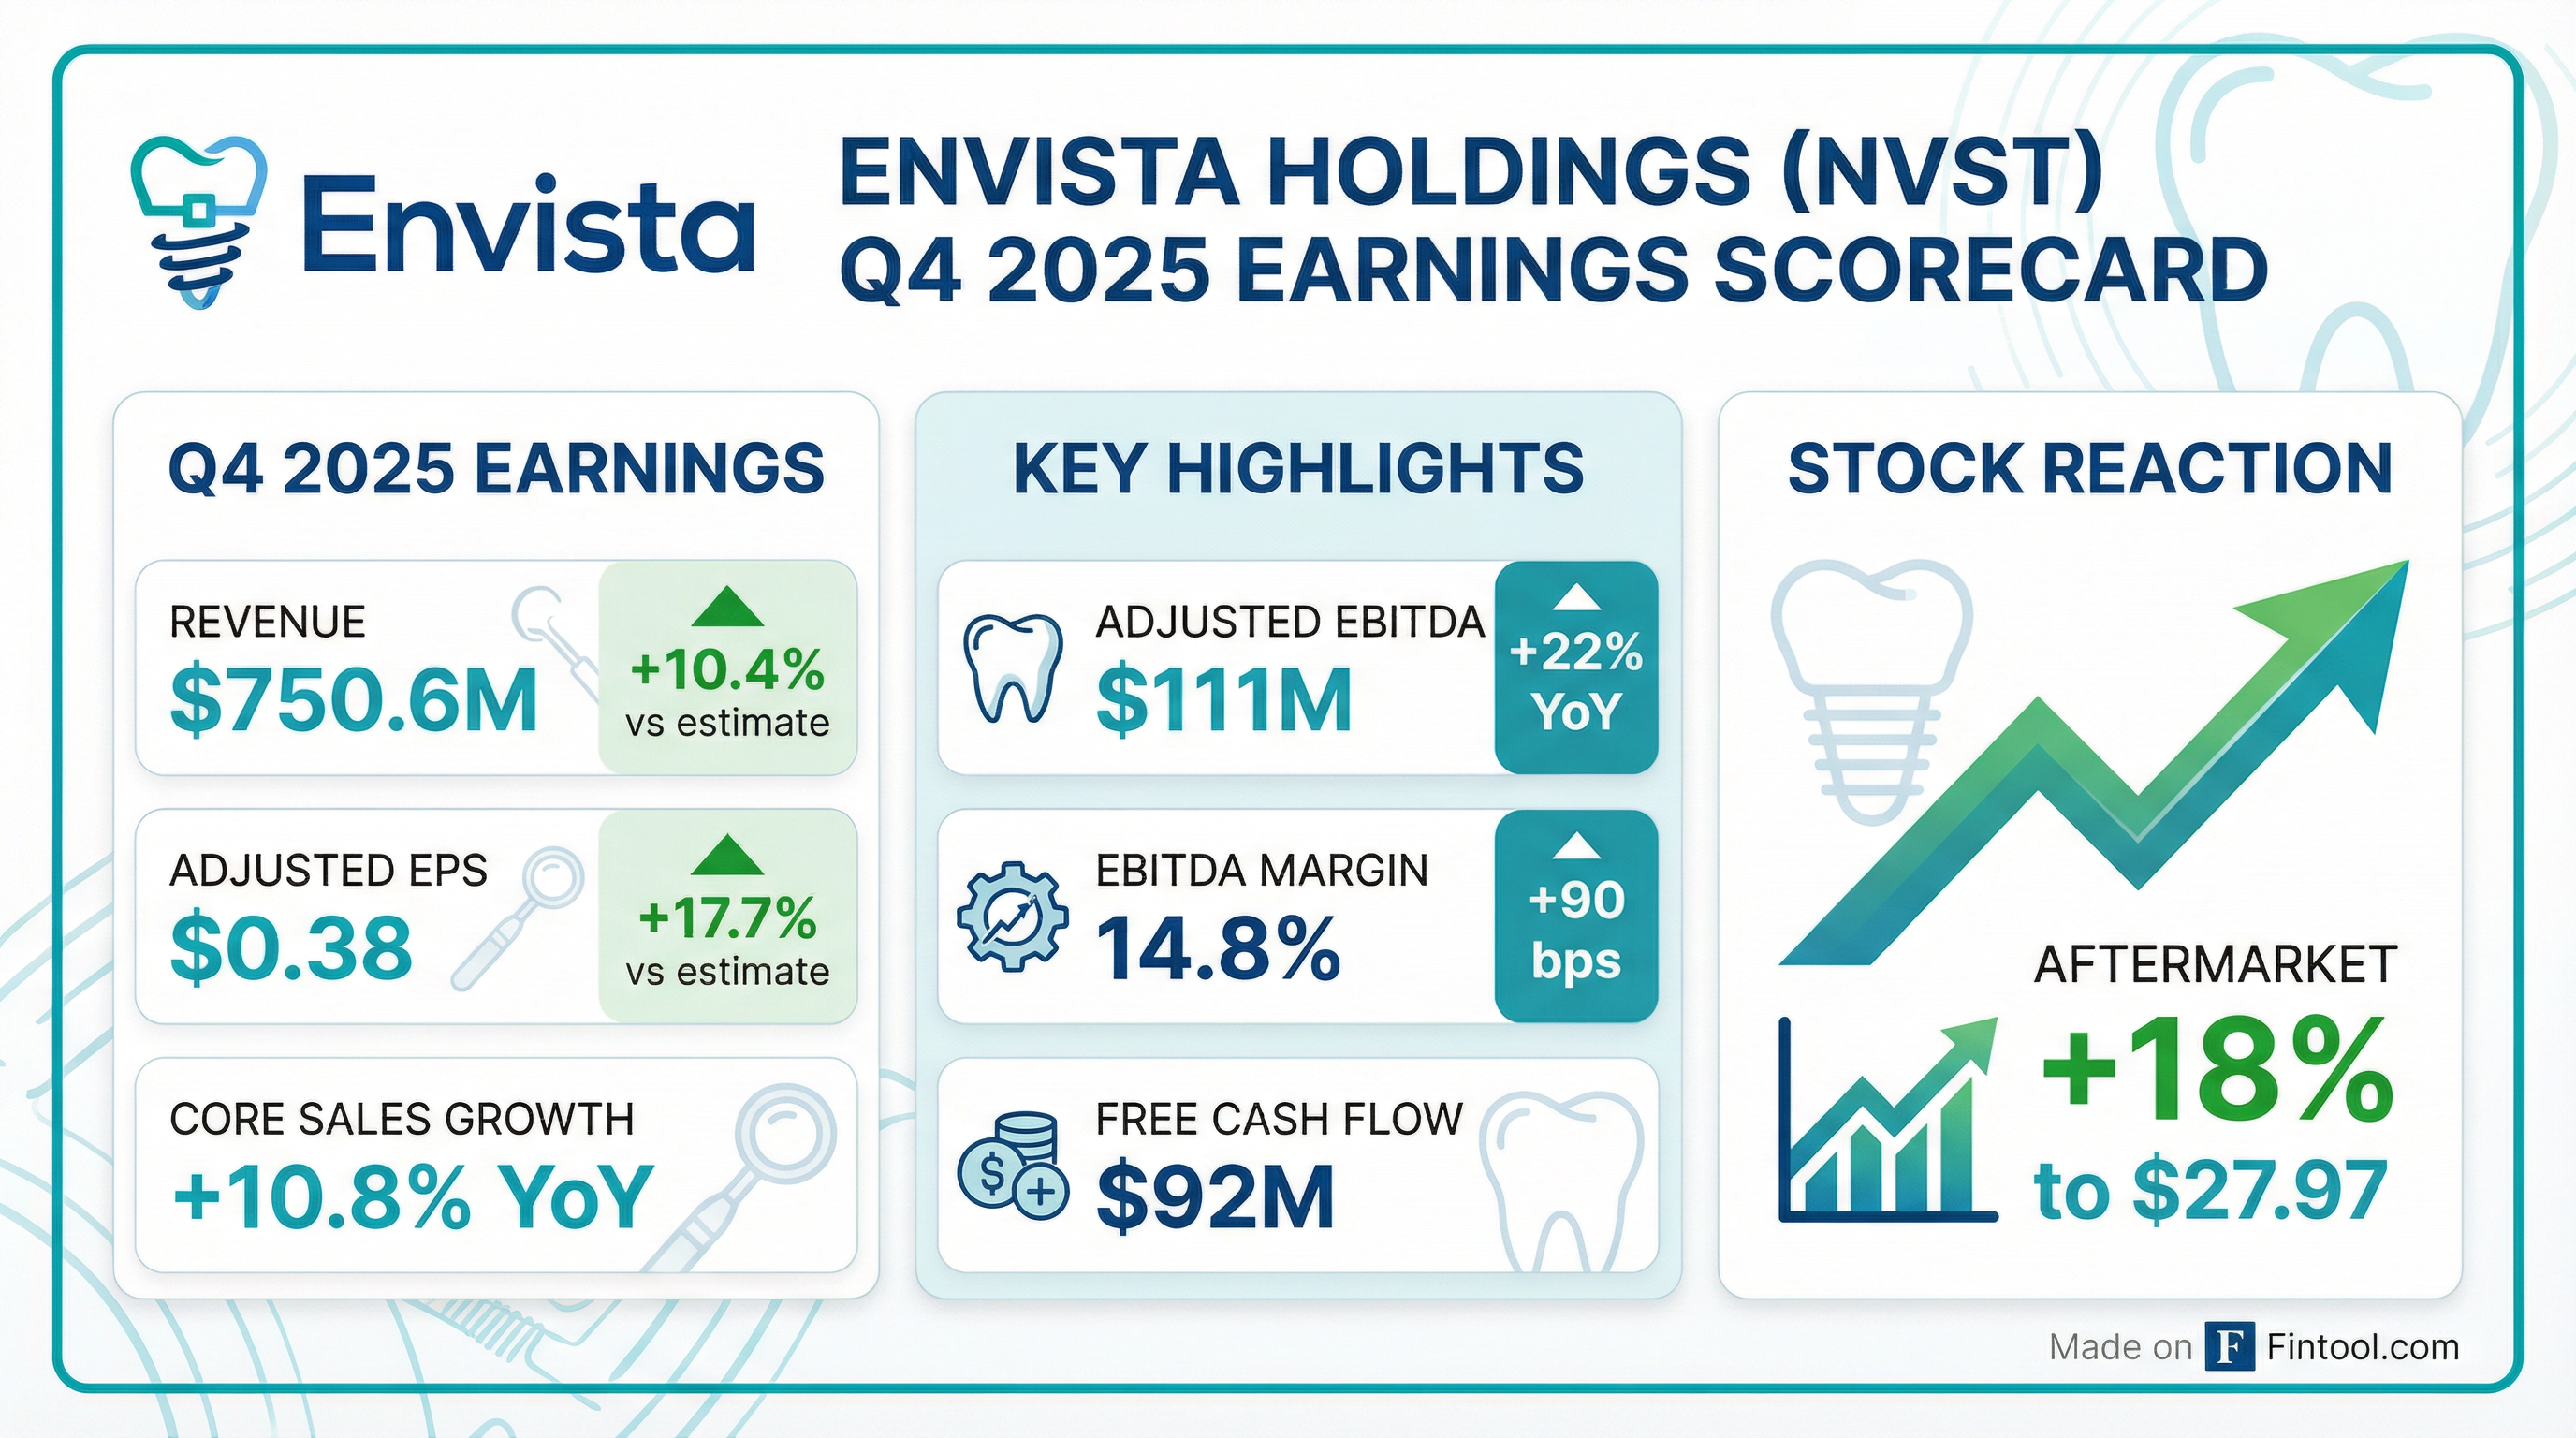
Envista Holdings (NYSE: NVST) delivered a blowout Q4 2025, crushing Wall Street estimates on both the top and bottom line as the dental equipment company's turnaround strategy gains traction. Revenue came in at $750.6 million (+10.4% beat), while adjusted EPS of $0.38 topped consensus by 17.7% . The stock surged 18% in after-hours trading to $27.97, extending what has been a dramatic recovery from 52-week lows.
Did Envista Beat Earnings?
Yes — decisively. This marks five consecutive quarters of beats as CEO Paul Keel's "Growth, Operations, and People" framework delivers results.
The magnitude of the revenue beat is notable — $70 million above consensus represents one of the largest positive surprises in the company's history as a public company.
Beat/Miss Streak: Envista has now beaten estimates for five consecutive quarters, a stark reversal from the challenging period in early 2024 when the company took a $1.15 billion goodwill impairment charge .
What Did Management Say?
CEO Paul Keel emphasized the broad-based nature of the improvement:
"With our disciplined focus on Growth, Operations, and People, Q4 2025 marked another quarter of continued progress for Envista. We delivered 10.8% core revenue growth and 22% adjusted EBITDA growth in Q4, and 6.5% core revenue growth and 26% EBITDA growth for the full-year 2025."
Key operational highlights for 2025 :
- All major businesses and geographies delivered positive growth with continued market share gains
- ~$100M in revenue from new products introduced during the year
- ~3% price contribution in Q4 and ~2% for full-year 2025, consistent with dental market inflation
- 30% increase in customer training vs 2024
- Double-digit increase in R&D investment to support innovation-led growth
- G&A expenses reduced by 10% company-wide
- Tax actions expected to result in ~4 point tax rate reduction in 2026
- $166 million returned to shareholders through buybacks (9.2M shares)
How Did Each Segment Perform?
Geographic Performance: Growth was broad-based across all regions in Q4. North America, Western Europe, and emerging markets all posted strong growth. China saw particularly high growth due to easy comparisons from Q4 2024 ortho VBP preparation .
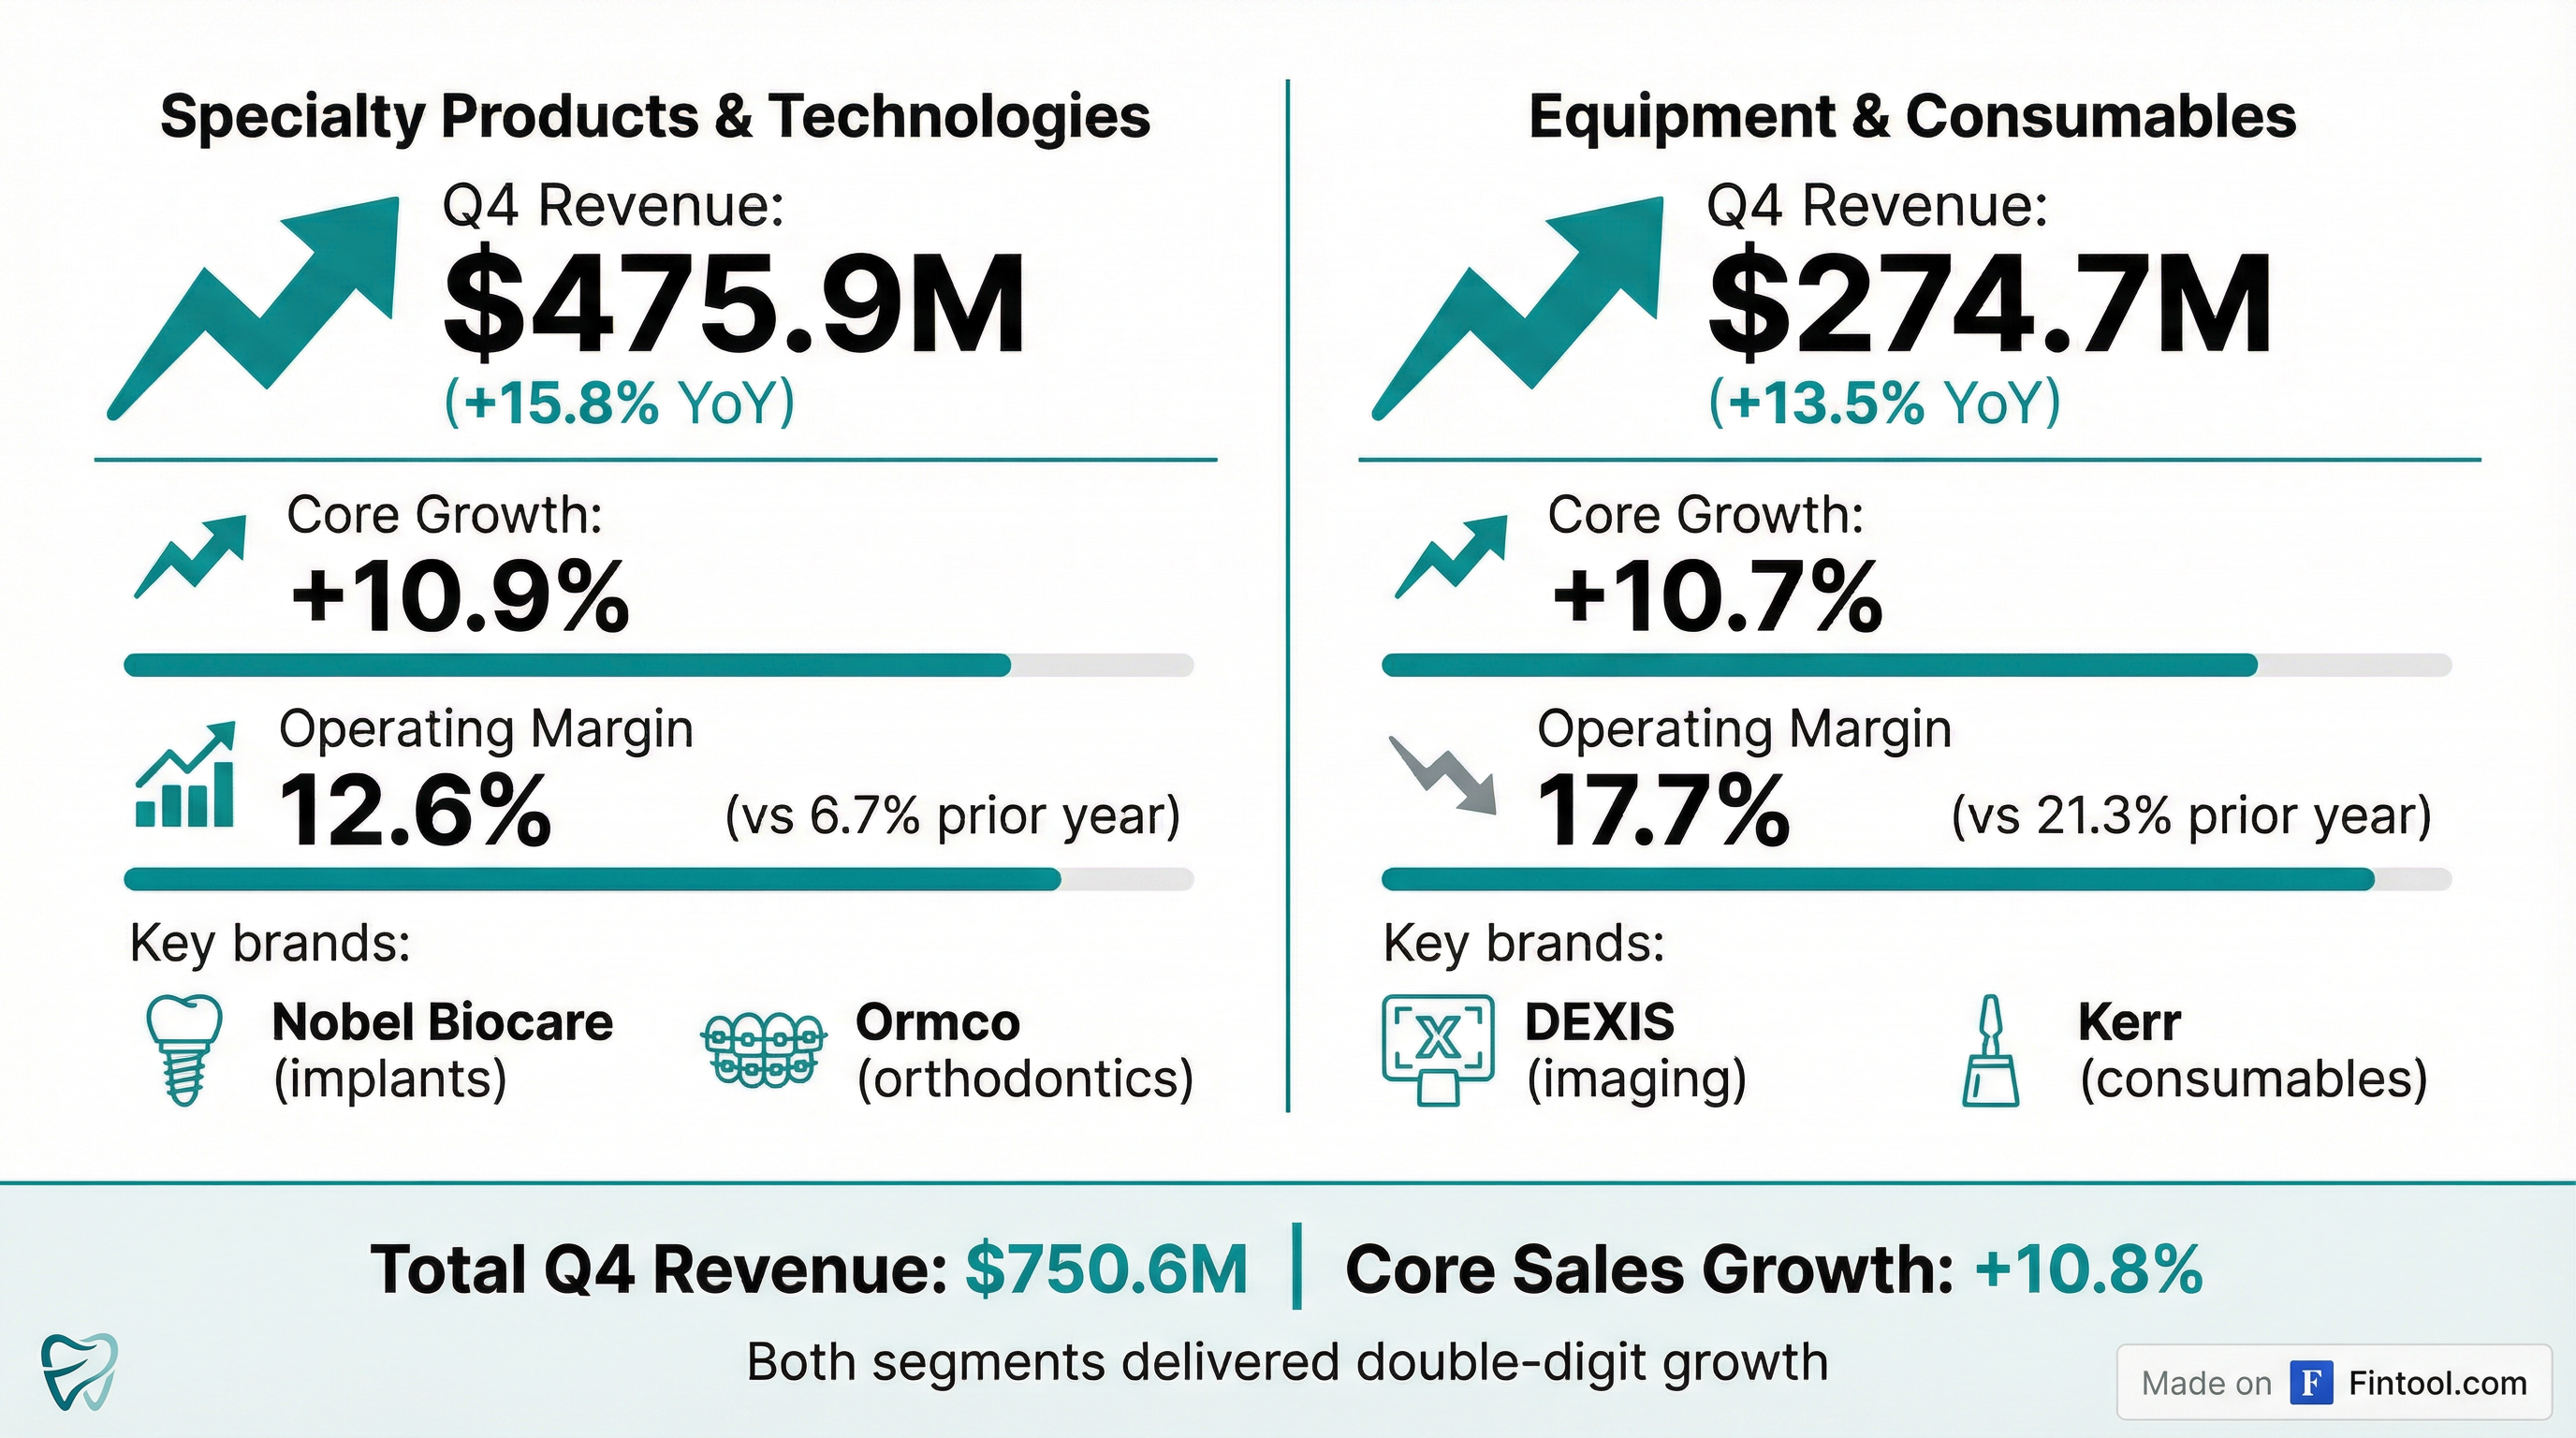
Both segments delivered double-digit growth, though the mix shows Specialty Products driving margin expansion while Equipment & Consumables saw margin compression:
Specialty Products & Technologies drove the margin story with operating margin expanding 470 bps to 16.2%. Key drivers:
- Spark sales grew high-single-digits excluding net deferral changes
- Brackets & Wires up double-digits
- Implants up mid-single-digits with growth in both Premium and Challenger tiers
- Positive price capture and strong operational improvements
Equipment & Consumables saw margin compress 510 bps to 20.1% despite strong growth. Management attributed this to:
- New product and commercialization investments to support future growth
- Transactional FX headwinds year-over-year
- Consumables up high-single-digits across the portfolio
- Diagnostics up double-digits globally, high-single-digit growth in North America
What Drove the Margin Expansion?
The Q4 EBITDA margin walk from 13.9% to 14.8% shows the key drivers of profitability improvement :
The positive drivers (Spark deferral normalization, pricing power, productivity gains) more than offset headwinds from tariffs, growth investments, and FX. The tariff impact reflects ~$30M in 2025 costs, with ~$40M expected in 2026 on an annualized basis .
What Did Management Guide?
Guidance Upside and Risks
Management provided unusually detailed color on what could move results above or below the 2-4% core growth guide :
Potential Upsides:
- Momentum: Five consecutive quarters of accelerating growth provides tailwind
- Diagnostics: North American market returned to growth in H2 2025 after three years of contraction — if sustained, material upside
- Consumables: Up high single-digits in 2025 behind price, new products, and DSO penetration investments
- Pricing power: If inflation remains elevated, company positioned to capture incremental price
Key Risks:
- Macro volatility: Tariffs, interest rates, and consumer confidence all impact dental demand
- China VBP timing: At 7% of sales, VBP implementation timing is difficult to forecast
Envista provided 2026 guidance that implies continued, albeit moderated, growth:
Key Guidance Assumptions :
The guidance suggests management is baking in conservatism on the top line while committing to continued operating leverage. The ~$15M Spark deferral tailwind in H1 will normalize by mid-year. Adjusted EPS guidance of $1.35-$1.45 implies 13-22% growth even on modest revenue, driven by continued margin expansion and tax rate reduction.
How Did the Stock React?
NVST surged 18% in after-hours trading following the results:
The after-hours price of $27.97 represents a new 52-week high, up nearly 100% from the 52-week low of $14.22. The stock had already been recovering heading into earnings, trading 10% above its 50-day moving average and 22% above its 200-day moving average.
What Changed From Last Quarter?
The Q4 results represent an acceleration from Q3 on several fronts:
The sequential improvement demonstrates the business is building momentum rather than just lapping easy comparisons. Q4 is typically a strong seasonal quarter for dental equipment given year-end purchasing, but the magnitude of the beat suggests underlying improvement beyond seasonality.
What Deviated to the Upside in Q4: Management identified two specific factors that drove results above their own expectations :
- China ortho VBP shift: The expected December VBP implementation was delayed, meaning the ortho bracket and wire market was stronger than anticipated (~1 point of growth impact)
- Implants digital portfolio: Growth in treatment planning, prosthetics, and guided surgery exceeded expectations
What's the China VBP Outlook?
China Volume-Based Procurement remains a key swing factor at ~7% of revenues. Management provided detailed VBP expectations :
Key VBP Dynamics:
- For ortho, expect pattern similar to implants VBP 1: ~40-45% price decrease offset by ~100% volume increase
- Orthodontic volume expansion likely slower than implants (18-month treatment vs shorter procedure)
- Envista is large player in traditional brackets/wires but smaller in clear aligners in China
- Net revenue impact expected to be positive over 12-18 months
- Typical pattern: 1-2 quarters of negative orders pre-VBP (channel destocking), followed by order acceleration post-implementation
"We saw a more rapid expansion in patient demand [with implants]. I think we're going to see less of that on the orthodontic side... it's typically an 18-month procedure treatment, so a little bit harder to expand."
Q&A Highlights
Spark Profitability Trajectory
Spark turned profitable in Q3 2025 and maintained consistent profitability in Q4. Key metrics from the call :
- Unit costs: Down mid-teens YoY, modestly down sequentially
- Profitability path: Automation, manufacturing cost-out, portfolio optimization, design cost reduction
- StageRx product: Driving design efficiency from front-end clinical level through manufacturing
- Fleet average: Remains the target for long-term operating margin
Implants: First Quarter of Market Outperformance
Management highlighted Q4 as a milestone quarter for the implants franchise :
"That's the first quarter since I've been here where I think we did outgrow the market in implants in total. So that's also now five straight quarters for premium growth and generally accelerating quarter sequentially."
- Global implant market growing mid-single-digits (~5%)
- Envista grew mid-single-digits+ in Q4
- Strong digital portfolio (treatment planning, prosthetics, guided surgery)
- $25M investment in commercial front-end and customer training in 2024 now yielding returns
Management on Rebuilding Credibility
CEO Paul Keel emphasized the pattern of consistent delivery :
"We're committed to rebuilding our track record of consistent delivery. This is now my seventh earnings call, and hopefully you're seeing a pattern develop both of steadily improving performance, but also credible, transparent reporting."
Diagnostics Market Outlook
Management characterized diagnostics as a low single-digit growth category, with Envista outpacing the market for the last couple of quarters. Expects similar dynamics in H1 2026 .
What Are the Key Risks?
Despite the strong results, several risks warrant monitoring:
-
Guidance deceleration: 2026 guidance of 2-4% core growth is notably slower than the 6.5% delivered in 2025, suggesting management sees headwinds ahead
-
China VBP timing uncertainty: At 7% of revenues, VBP timing is difficult to forecast — government delays have been common, and quarter-by-quarter effects can vary significantly
-
Equipment & Consumables margin pressure: Operating margin declined 510 bps to 20.1% due to growth investments and FX — if investments don't drive future growth, this could become a structural drag
-
Currency headwinds: FX reduced reported growth by 3.9 percentage points in Q4, and with a stronger dollar environment, this headwind could persist
-
Cash flow normalization: Free cash flow of $231M in 2025 was down from $303M in 2024, and guidance for ~100% conversion (vs 114% in 2025) suggests further normalization. That said, the balance sheet remains strong with Net Debt/EBITDA of just ~0.6x
Capital Allocation
Envista deployed capital aggressively toward buybacks in 2025:
- Q4 2025: Repurchased 1.2 million shares for ~$24 million
- Full Year 2025: Repurchased 9.2 million shares for ~$166 million at an average price of $18.06
- Remaining authorization: ~$84 million
The buyback activity was well-timed, with shares purchased at an average of $18.06 now trading at $27.97 in after-hours — representing a 55% paper gain on the repurchases.
Forward Catalysts
- Q1 2026 earnings (late April/early May): First read on 2026 trajectory
- Spark clear aligners momentum: Positive margin in H2 2025 could expand further
- Nobel Biocare innovation: Double-digit R&D increase should yield new products
- M&A optionality: Balance sheet has capacity with $1.2B cash and moderate leverage
Key Financial Tables
Income Statement Summary (Q4 2025 vs Q4 2024)
Balance Sheet Highlights (Dec 31, 2025)
Cash Flow Summary
Last updated: February 5, 2026 (Updated with Q&A highlights from earnings call transcript)
Related Links: